Masking and reducing data-cubes using geometry objects
[1]:
# If first time running, uncomment the line below to install any additional dependancies
# !bash requirements-for-notebooks.sh
[2]:
import matplotlib.pyplot as plt

from earthkit.transforms import aggregate as ek_aggregate
from earthkit import data as ek_data

from earthkit.data.testing import earthkit_remote_test_data_file
Load some test data
All earthkit-aggregate methods can be called with earthkit-data objects (Readers and Wrappers) or with the pre-loaded xarray or geopandas objects.
In this example we will use hourly ERA5 2m temperature data on a 0.5x0.5 spatial grid for the year 2015 as our physical data; and we will use the NUTS geometries which are stored in a geojson file.
First we lazily load the ERA5 data and NUTS geometries from our test-data repository.
Note the data is only downloaded when we use it, e.g. at the .to_xarray line, additionally, the download is cached so the next time you run this cell you will not need to re-download the file (unless it has been a very long time since you have run the code, please see tutorials in earthkit-data for more details in cache management).
[3]:
# Get some demonstration ERA5 data, this could be any url or path to an ERA5 grib or netCDF file.
# remote_era5_file = earthkit_remote_test_data_file("test-data", "era5_temperature_europe_2015.grib") # Large file
remote_era5_file = earthkit_remote_test_data_file("test-data", "era5_temperature_europe_20150101.grib")
era5_data = ek_data.from_source("url", remote_era5_file)
era5_data.to_xarray()
[3]:
<xarray.Dataset> Size: 5MB
Dimensions:     (number: 1, time: 24, step: 1, surface: 1, latitude: 201,
                 longitude: 281)
Coordinates:
  * number      (number) int64 8B 0
  * time        (time) datetime64[ns] 192B 2015-01-01 ... 2015-01-01T23:00:00
  * step        (step) timedelta64[ns] 8B 00:00:00
  * surface     (surface) float64 8B 0.0
  * latitude    (latitude) float64 2kB 80.0 79.75 79.5 79.25 ... 30.5 30.25 30.0
  * longitude   (longitude) float64 2kB -10.0 -9.75 -9.5 ... 59.5 59.75 60.0
    valid_time  (time, step) datetime64[ns] 192B ...
Data variables:
    t2m         (number, time, step, surface, latitude, longitude) float32 5MB ...
Attributes:
    GRIB_edition:            1
    GRIB_centre:             ecmf
    GRIB_centreDescription:  European Centre for Medium-Range Weather Forecasts
    GRIB_subCentre:          0
    Conventions:             CF-1.7
    institution:             European Centre for Medium-Range Weather Forecasts
history: 2024-07-12T08:59 GRIB to CDM+CF via cfgrib-0.9.1...[4]:
# Use some demonstration polygons stored, this could be any url or path to geojson file
remote_nuts_url = earthkit_remote_test_data_file("test-data", "NUTS_RG_60M_2021_4326_LEVL_0.geojson")
nuts_data = ek_data.from_source("url", remote_nuts_url)

nuts_data.to_pandas()[:5]
[4]:
| id | NUTS_ID | LEVL_CODE | CNTR_CODE | NAME_LATN | NUTS_NAME | MOUNT_TYPE | URBN_TYPE | COAST_TYPE | FID | geometry | |
|---|---|---|---|---|---|---|---|---|---|---|---|
| 0 | DK | DK | 0 | DK | Danmark | Danmark | 0 | 0 | 0 | DK | MULTIPOLYGON (((15.1629 55.0937, 15.094 54.996... |
| 1 | RS | RS | 0 | RS | Serbia | Srbija/Сpбија | 0 | 0 | 0 | RS | POLYGON ((21.4792 45.193, 21.3585 44.8216, 22.... |
| 2 | EE | EE | 0 | EE | Eesti | Eesti | 0 | 0 | 0 | EE | MULTIPOLYGON (((27.357 58.7871, 27.6449 57.981... |
| 3 | EL | EL | 0 | EL | Elláda | Ελλάδα | 0 | 0 | 0 | EL | MULTIPOLYGON (((28.0777 36.1182, 27.8606 35.92... |
| 4 | ES | ES | 0 | ES | España | España | 0 | 0 | 0 | ES | MULTIPOLYGON (((4.391 39.8617, 4.1907 39.7981,... |
Mask dataarray with geodataframe
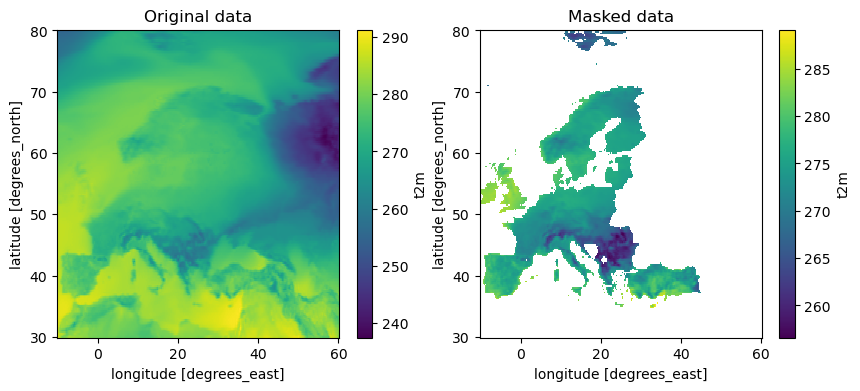
shapes.mask applies all the features in the geometry object (nuts_data) to the data object (era5_data). It returns an xarray object the same shape and type as the input xarray object with all points outside of the geometry masked
[5]:
single_masked_data = ek_aggregate.spatial.mask(era5_data, nuts_data)
single_masked_data
[5]:
<xarray.Dataset> Size: 5MB
Dimensions:     (number: 1, time: 24, step: 1, surface: 1, latitude: 201,
                 longitude: 281)
Coordinates:
  * number      (number) int64 8B 0
  * time        (time) datetime64[ns] 192B 2015-01-01 ... 2015-01-01T23:00:00
  * step        (step) timedelta64[ns] 8B 00:00:00
  * surface     (surface) float64 8B 0.0
  * latitude    (latitude) float64 2kB 80.0 79.75 79.5 79.25 ... 30.5 30.25 30.0
  * longitude   (longitude) float64 2kB -10.0 -9.75 -9.5 ... 59.5 59.75 60.0
    valid_time  (time, step) datetime64[ns] 192B ...
Data variables:
    t2m         (number, time, step, surface, latitude, longitude) float32 5MB ...
Attributes:
    GRIB_edition:            1
    GRIB_centre:             ecmf
    GRIB_centreDescription:  European Centre for Medium-Range Weather Forecasts
    GRIB_subCentre:          0
    Conventions:             CF-1.7
    institution:             European Centre for Medium-Range Weather Forecasts
history: 2024-07-12T08:59 GRIB to CDM+CF via cfgrib-0.9.1...[6]:
fig, axes = plt.subplots(1, 2, figsize=(10,4))
era5_data.to_xarray().t2m.mean(dim='time').plot(ax=axes[0])
axes[0].set_title('Original data')
# Single masked data
single_masked_data.t2m.mean(dim='time').plot(ax=axes[1])
axes[1].set_title('Masked data')
[6]:
Text(0.5, 1.0, 'Masked data')
shapes.masks applies the features in the geometry object (nuts_data) to the data object (era5_data). It returns an xarray object with an additional dimension, and coordinate variable, corresponding to the features in the geometry object. By default this is the index of the input geodataframe, in this example the index is just an integer count so it takes the default name index.
[7]:
masked_data = ek_aggregate.spatial.masks(era5_data, nuts_data)
masked_data
[7]:
<xarray.Dataset> Size: 201MB
Dimensions:     (index: 37, number: 1, time: 24, step: 1, surface: 1,
                 latitude: 201, longitude: 281)
Coordinates:
  * number      (number) int64 8B 0
  * time        (time) datetime64[ns] 192B 2015-01-01 ... 2015-01-01T23:00:00
  * step        (step) timedelta64[ns] 8B 00:00:00
  * surface     (surface) float64 8B 0.0
  * latitude    (latitude) float64 2kB 80.0 79.75 79.5 79.25 ... 30.5 30.25 30.0
  * longitude   (longitude) float64 2kB -10.0 -9.75 -9.5 ... 59.5 59.75 60.0
    valid_time  (time, step) datetime64[ns] 192B dask.array<chunksize=(24, 1), meta=np.ndarray>
  * index       (index) int64 296B 0 1 2 3 4 5 6 7 8 ... 29 30 31 32 33 34 35 36
Data variables:
    t2m         (index, number, time, step, surface, latitude, longitude) float32 201MB dask.array<chunksize=(1, 1, 24, 1, 1, 201, 281), meta=np.ndarray>
Attributes:
    GRIB_edition:            1
    GRIB_centre:             ecmf
    GRIB_centreDescription:  European Centre for Medium-Range Weather Forecasts
    GRIB_subCentre:          0
    Conventions:             CF-1.7
    institution:             European Centre for Medium-Range Weather Forecasts
history: 2024-07-12T08:59 GRIB to CDM+CF via cfgrib-0.9.1...It is possible to specify a column in the geodataframe to use for the new dimension, for example in NUTS the FID (= feature id) which contains the two letter identier code for each feature:
[8]:
masked_data = ek_aggregate.spatial.masks(era5_data, nuts_data, mask_dim="FID")
masked_data
[8]:
<xarray.Dataset> Size: 201MB
Dimensions:     (FID: 37, number: 1, time: 24, step: 1, surface: 1,
                 latitude: 201, longitude: 281)
Coordinates:
  * number      (number) int64 8B 0
  * time        (time) datetime64[ns] 192B 2015-01-01 ... 2015-01-01T23:00:00
  * step        (step) timedelta64[ns] 8B 00:00:00
  * surface     (surface) float64 8B 0.0
  * latitude    (latitude) float64 2kB 80.0 79.75 79.5 79.25 ... 30.5 30.25 30.0
  * longitude   (longitude) float64 2kB -10.0 -9.75 -9.5 ... 59.5 59.75 60.0
    valid_time  (time, step) datetime64[ns] 192B dask.array<chunksize=(24, 1), meta=np.ndarray>
  * FID         (FID) object 296B 'DK' 'RS' 'EE' 'EL' ... 'CY' 'CZ' 'DE' 'NO'
Data variables:
    t2m         (FID, number, time, step, surface, latitude, longitude) float32 201MB dask.array<chunksize=(1, 1, 24, 1, 1, 201, 281), meta=np.ndarray>
Attributes:
    GRIB_edition:            1
    GRIB_centre:             ecmf
    GRIB_centreDescription:  European Centre for Medium-Range Weather Forecasts
    GRIB_subCentre:          0
    Conventions:             CF-1.7
    institution:             European Centre for Medium-Range Weather Forecasts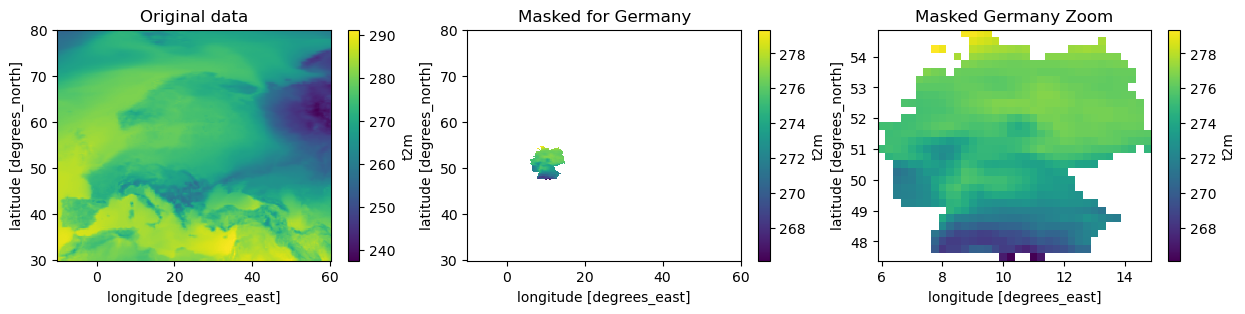
history: 2024-07-12T08:59 GRIB to CDM+CF via cfgrib-0.9.1...Here we demonstrate what we have done by plotting the masked objects we have produced
[9]:
fig, axes = plt.subplots(1, 3, figsize=(15,3))
era5_data.to_xarray().t2m.mean(dim='time').plot(ax=axes[0])
axes[0].set_title('Original data')
masked_data.t2m.sel(FID='DE').mean(dim='time').plot(ax=axes[1])
axes[1].set_title('Masked for Germany')
germany_data = masked_data.sel(FID='DE').dropna(dim='latitude', how='all').dropna(dim='longitude', how='all')
germany_data.t2m.mean(dim='time').plot(ax=axes[2])
axes[2].set_title('Masked Germany Zoom')
[9]:
Text(0.5, 1.0, 'Masked Germany Zoom')
Reduce data
Default behaviour
The default behaviour is to reduce the data along the spatial dimensions, only, and return the reduced data in the Xarray format it was provided, i.e. xr.DataArray or xr.Dataset.
The returned object has a new dimension FID (feature id) which has a coordinate variable with the values of the FID column in the input geodataframe.
The new variable name is made up of the original variable name and the method used to reduce, e.g. t2m_mean
[10]:
reduced_data = ek_aggregate.spatial.reduce(era5_data, nuts_data)
reduced_data
[10]:
<xarray.Dataset> Size: 4kB
Dimensions:     (time: 24, index: 37)
Coordinates:
    number      int64 8B 0
  * time        (time) datetime64[ns] 192B 2015-01-01 ... 2015-01-01T23:00:00
    step        timedelta64[ns] 8B 00:00:00
    surface     float64 8B 0.0
    valid_time  (time) datetime64[ns] 192B 2015-01-01 ... 2015-01-01T23:00:00
  * index       (index) int64 296B 0 1 2 3 4 5 6 7 8 ... 29 30 31 32 33 34 35 36
Data variables:
    t2m         (index, time) float32 4kB 278.7 278.9 279.1 ... 272.7 272.6
Attributes:
    GRIB_edition:            1
    GRIB_centre:             ecmf
    GRIB_centreDescription:  European Centre for Medium-Range Weather Forecasts
    GRIB_subCentre:          0
    Conventions:             CF-1.7
    institution:             European Centre for Medium-Range Weather Forecasts
history: 2024-07-12T08:59 GRIB to CDM+CF via cfgrib-0.9.1...Reduce along additional dimension
For example, any time dimension, this is advisable as it ensures correct handling missing values and weights.
The extra_reduce_dims argument takes a single string or a list of strings corresponding to dimensions to include in the reduction.
It is also possible to select a column in the geodataframe to use to populate the dimension and coordinate variable created by the reduction using the mask_dim kwarg, here we choose the "FID" column.
[11]:
reduced_data = ek_aggregate.spatial.reduce(era5_data, nuts_data, mask_dim="FID", extra_reduce_dims='time', all_touched=True)
reduced_data
[11]:
<xarray.Dataset> Size: 468B
Dimensions:  (FID: 37)
Coordinates:
    number   int64 8B 0
    step     timedelta64[ns] 8B 00:00:00
    surface  float64 8B 0.0
  * FID      (FID) object 296B 'DK' 'RS' 'EE' 'EL' 'ES' ... 'CY' 'CZ' 'DE' 'NO'
Data variables:
    t2m      (FID) float32 148B 279.5 261.4 276.2 274.3 ... 272.8 274.5 272.9
Attributes:
    GRIB_edition:            1
    GRIB_centre:             ecmf
    GRIB_centreDescription:  European Centre for Medium-Range Weather Forecasts
    GRIB_subCentre:          0
    Conventions:             CF-1.7
    institution:             European Centre for Medium-Range Weather Forecasts
history: 2024-07-12T08:59 GRIB to CDM+CF via cfgrib-0.9.1...Weighted reduction
Provide numpy/xarray arrays of weights, or use predefined weights options, i.e. latitude:
[12]:
reduced_data_xr = ek_aggregate.spatial.reduce(era5_data, nuts_data, weights='latitude', mask_dim="FID", extra_reduce_dims='time', all_touched=True)
reduced_data_xr
[12]:
<xarray.Dataset> Size: 616B
Dimensions:  (FID: 37)
Coordinates:
    number   int64 8B 0
    step     timedelta64[ns] 8B 00:00:00
    surface  float64 8B 0.0
  * FID      (FID) object 296B 'DK' 'RS' 'EE' 'EL' 'ES' ... 'CY' 'CZ' 'DE' 'NO'
Data variables:
    t2m      (FID) float64 296B 279.5 261.3 276.2 274.4 ... 272.8 274.4 274.1
Attributes:
    GRIB_edition:            1
    GRIB_centre:             ecmf
    GRIB_centreDescription:  European Centre for Medium-Range Weather Forecasts
    GRIB_subCentre:          0
    Conventions:             CF-1.7
    institution:             European Centre for Medium-Range Weather Forecasts
history: 2024-07-12T08:59 GRIB to CDM+CF via cfgrib-0.9.1...Return as a pandas dataframe
WARNING: Returning reduced data in pandas format is considered experimental and may change in futureversions of earthkit
It is possible to return the reduced data in a fully expanded geopandas dataframe which contains the geometry and aggregated data. Additional columns for the data values and rows and indexes added to fully describe the reduced data.
The returned object fully supports pandas indexing and in-built convenience methods (e.g. plotting), but it comes with memory usage cost, hence in this example we reduce along all dimensions.
[13]:
reduced_data_pd = ek_aggregate.spatial.reduce(era5_data, nuts_data, return_as="pandas", mask_dim="FID", extra_reduce_dims="time")
reduced_data_pd[:10]
Returning reduced data in pandas format is considered experimental and may change in futureversions of earthkit
[13]:
| id | NUTS_ID | LEVL_CODE | CNTR_CODE | NAME_LATN | NUTS_NAME | MOUNT_TYPE | URBN_TYPE | COAST_TYPE | FID | geometry | number | step | surface | t2m | |
|---|---|---|---|---|---|---|---|---|---|---|---|---|---|---|---|
| FID | |||||||||||||||
| DK | DK | DK | 0 | DK | Danmark | Danmark | 0 | 0 | 0 | DK | MULTIPOLYGON (((15.1629 55.0937, 15.094 54.996... | 0 | 0 days | 0.0 | 279.547363 |
| RS | RS | RS | 0 | RS | Serbia | Srbija/Сpбија | 0 | 0 | 0 | RS | POLYGON ((21.4792 45.193, 21.3585 44.8216, 22.... | 0 | 0 days | 0.0 | 261.353851 |
| EE | EE | EE | 0 | EE | Eesti | Eesti | 0 | 0 | 0 | EE | MULTIPOLYGON (((27.357 58.7871, 27.6449 57.981... | 0 | 0 days | 0.0 | 276.197968 |
| EL | EL | EL | 0 | EL | Elláda | Ελλάδα | 0 | 0 | 0 | EL | MULTIPOLYGON (((28.0777 36.1182, 27.8606 35.92... | 0 | 0 days | 0.0 | 274.270966 |
| ES | ES | ES | 0 | ES | España | España | 0 | 0 | 0 | ES | MULTIPOLYGON (((4.391 39.8617, 4.1907 39.7981,... | 0 | 0 days | 0.0 | 277.095337 |
| FI | FI | FI | 0 | FI | Suomi/Finland | Suomi/Finland | 0 | 0 | 0 | FI | MULTIPOLYGON (((28.8967 69.0426, 28.4782 68.51... | 0 | 0 days | 0.0 | 273.923889 |
| FR | FR | FR | 0 | FR | France | France | 0 | 0 | 0 | FR | MULTIPOLYGON (((55.8498 -21.1858, 55.7858 -21.... | 0 | 0 days | 0.0 | 272.965454 |
| HR | HR | HR | 0 | HR | Hrvatska | Hrvatska | 0 | 0 | 0 | HR | MULTIPOLYGON (((17.6515 45.8478, 17.9121 45.79... | 0 | 0 days | 0.0 | 267.700714 |
| HU | HU | HU | 0 | HU | Magyarország | Magyarország | 0 | 0 | 0 | HU | POLYGON ((22.1211 48.3783, 22.1553 48.4034, 22... | 0 | 0 days | 0.0 | 268.251129 |
| IE | IE | IE | 0 | IE | Éire/Ireland | Éire/Ireland | 0 | 0 | 0 | IE | POLYGON ((-7.1885 54.3377, -6.8642 54.3302, -6... | 0 | 0 days | 0.0 | 283.832977 |
[14]:
reduced_data_pd.plot("t2m_mean")
print('# Note that the NUTS regions include French foreign territories, hence the extent of the figure.')
---------------------------------------------------------------------------
KeyError                                  Traceback (most recent call last)
File /opt/homebrew/Caskroom/miniforge/base/envs/earthkit/lib/python3.11/site-packages/pandas/core/indexes/base.py:3805, in Index.get_loc(self, key)
   3804 try:
-> 3805     return self._engine.get_loc(casted_key)
   3806 except KeyError as err:

File index.pyx:167, in pandas._libs.index.IndexEngine.get_loc()

File index.pyx:196, in pandas._libs.index.IndexEngine.get_loc()

File pandas/_libs/hashtable_class_helper.pxi:7081, in pandas._libs.hashtable.PyObjectHashTable.get_item()

File pandas/_libs/hashtable_class_helper.pxi:7089, in pandas._libs.hashtable.PyObjectHashTable.get_item()

KeyError: 't2m_mean'

The above exception was the direct cause of the following exception:

KeyError                                  Traceback (most recent call last)
Cell In[14], line 1
----> 1 reduced_data_pd.plot("t2m_mean")
      2 print('# Note that the NUTS regions include French foreign territories, hence the extent of the figure.')

File /opt/homebrew/Caskroom/miniforge/base/envs/earthkit/lib/python3.11/site-packages/geopandas/plotting.py:968, in GeoplotAccessor.__call__(self, *args, **kwargs)
    966 kind = kwargs.pop("kind", "geo")
    967 if kind == "geo":
--> 968     return plot_dataframe(data, *args, **kwargs)
    969 if kind in self._pandas_kinds:
    970     # Access pandas plots
    971     return PlotAccessor(data)(kind=kind, **kwargs)

File /opt/homebrew/Caskroom/miniforge/base/envs/earthkit/lib/python3.11/site-packages/geopandas/plotting.py:715, in plot_dataframe(df, column, cmap, color, ax, cax, categorical, legend, scheme, k, vmin, vmax, markersize, figsize, legend_kwds, categories, classification_kwds, missing_kwds, aspect, autolim, **style_kwds)
    713             values = values.reindex(df.index)
    714 else:
--> 715     values = df[column]
    717 if isinstance(values.dtype, CategoricalDtype):
    718     if categories is not None:

File /opt/homebrew/Caskroom/miniforge/base/envs/earthkit/lib/python3.11/site-packages/geopandas/geodataframe.py:1750, in GeoDataFrame.__getitem__(self, key)
   1744 def __getitem__(self, key):
   1745     """
   1746     If the result is a column containing only 'geometry', return a
   1747     GeoSeries. If it's a DataFrame with any columns of GeometryDtype,
   1748     return a GeoDataFrame.
   1749     """
-> 1750     result = super().__getitem__(key)
   1751     # Custom logic to avoid waiting for pandas GH51895
   1752     # result is not geometry dtype for multi-indexes
   1753     if (
   1754         pd.api.types.is_scalar(key)
   1755         and key == ""
   (...)
   1758         and not is_geometry_type(result)
   1759     ):

File /opt/homebrew/Caskroom/miniforge/base/envs/earthkit/lib/python3.11/site-packages/pandas/core/frame.py:4102, in DataFrame.__getitem__(self, key)
   4100 if self.columns.nlevels > 1:
   4101     return self._getitem_multilevel(key)
-> 4102 indexer = self.columns.get_loc(key)
   4103 if is_integer(indexer):
   4104     indexer = [indexer]

File /opt/homebrew/Caskroom/miniforge/base/envs/earthkit/lib/python3.11/site-packages/pandas/core/indexes/base.py:3812, in Index.get_loc(self, key)
   3807     if isinstance(casted_key, slice) or (
   3808         isinstance(casted_key, abc.Iterable)
   3809         and any(isinstance(x, slice) for x in casted_key)
   3810     ):
   3811         raise InvalidIndexError(key)
-> 3812     raise KeyError(key) from err
   3813 except TypeError:
   3814     # If we have a listlike key, _check_indexing_error will raise
   3815     #  InvalidIndexError. Otherwise we fall through and re-raise
   3816     #  the TypeError.
   3817     self._check_indexing_error(key)

KeyError: 't2m_mean'
Appendix
Unadvised: return_as = ‘pandas’ for time-series
This results in very heavy memory usage but may be useful
[ ]:
reduced_data_pd = ek_aggregate.spatial.reduce(era5_data, nuts_data, return_as="pandas", mask_dim="FID")
reduced_data_pd[:5]
Returning reduced data in pandas format is considered experimental and may change in futureversions of earthkit-climate
| id | NUTS_ID | LEVL_CODE | CNTR_CODE | NAME_LATN | NUTS_NAME | MOUNT_TYPE | URBN_TYPE | COAST_TYPE | FID | geometry | number | step | surface | valid_time | t2m_mean | ||
|---|---|---|---|---|---|---|---|---|---|---|---|---|---|---|---|---|---|
| FID | time | ||||||||||||||||
| DK | 2015-01-01 00:00:00 | DK | DK | 0 | DK | Danmark | Danmark | 0 | 0 | 0 | DK | MULTIPOLYGON (((15.16290 55.09370, 15.09400 54... | 0 | 0 days | 0.0 | 2015-01-01 00:00:00 | 278.709229 |
| 2015-01-01 06:00:00 | DK | DK | 0 | DK | Danmark | Danmark | 0 | 0 | 0 | DK | MULTIPOLYGON (((15.16290 55.09370, 15.09400 54... | 0 | 0 days | 0.0 | 2015-01-01 06:00:00 | 279.765015 | |
| 2015-01-01 12:00:00 | DK | DK | 0 | DK | Danmark | Danmark | 0 | 0 | 0 | DK | MULTIPOLYGON (((15.16290 55.09370, 15.09400 54... | 0 | 0 days | 0.0 | 2015-01-01 12:00:00 | 279.772217 | |
| 2015-01-01 18:00:00 | DK | DK | 0 | DK | Danmark | Danmark | 0 | 0 | 0 | DK | MULTIPOLYGON (((15.16290 55.09370, 15.09400 54... | 0 | 0 days | 0.0 | 2015-01-01 18:00:00 | 279.575684 | |
| 2015-01-02 00:00:00 | DK | DK | 0 | DK | Danmark | Danmark | 0 | 0 | 0 | DK | MULTIPOLYGON (((15.16290 55.09370, 15.09400 54... | 0 | 0 days | 0.0 | 2015-01-02 00:00:00 | 279.826721 |
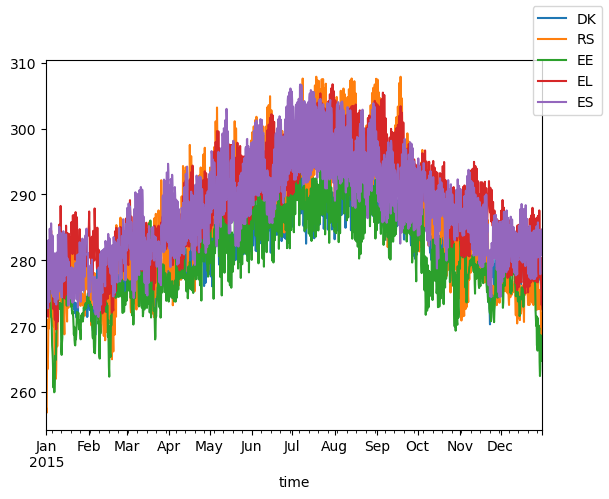
[ ]:
feature_index = "FID"
plot_var = "t2m_mean"
# plot_x_vals = reduced_data.attrs[f"{plot_var}_dims"]["time"]
fig, ax = plt.subplots(1)
for feature in reduced_data_pd.index.get_level_values(feature_index).unique()[:5]:
    temp = reduced_data_pd.xs(feature, level=feature_index)
    temp[plot_var].plot(ax=ax, label=feature)
fig.legend()
<matplotlib.legend.Legend at 0x155c5a530>